All services

Know what comes next, not only what happened

Data Science & Applied ML. A report tells you what already took place. A well-framed model anticipates demand, ranks priorities or checks what nobody has time to look at. I build predictive and analytical solutions for e-commerce and logistics, and computer vision projects, measured against the business outcome.

When it makes sense

  • Buying or production runs on gut feeling, and inventory pays for it.
  • Years of stored data that nobody uses to decide anything.
  • A repetitive visual check relies on nobody getting distracted.

What I deliver

  • Demand and stock forecasts
  • Predictive models for e-commerce and logistics
  • Computer vision for detection, counting and inspection
  • Model in production with performance tracking
  • Results report in business language

What I work with

  • Python
  • SQL
  • Machine learning
  • Computer vision

What it looks like

Examples built on synthetic data to show the shape of each deliverable. None belongs to a client.

Demand forecast

Twelve weeks of history and six projected, with what drives the number and where the risk is.

Synthetic data

Service level
97.2 %
+4.5 pp vs. previous method
Forecast error (MAPE)
8.4 %
−3.1 pp vs. previous method
Stockouts avoided
38
per quarter
Idle stock
−14 %
vs. last year

Weekly demand, in units

What drives demand

  • Seasonality 34 %
  • Promotions 27 %
  • Price 18 %
  • Weather 12 %
  • Holidays 9 %

Stockout risk, next six weeks

View the data as a table
Weekly demand, in units
Week units 80% band
1 820
2 845
3 810
4 870
5 905
6 880
7 930
8 960
9 940
10 985
11 1,010
12 1,040
13 1,065 ± 40
14 1,090 ± 55
15 1,075 ± 70
16 1,120 ± 85
17 1,150 ± 100
18 1,170 ± 115
What drives demand
Factor Weight
Seasonality 34 %
Promotions 27 %
Price 18 %
Weather 12 %
Holidays 9 %
Stockout risk, next six weeks
Family W 13 W 14 W 15 W 16 W 17 W 18
Beverages very lowlowlowmediumhighvery high
Snacks very lowvery lowlowlowlowmedium
Dairy lowmediumhighhighmediumlow
Cleaning very lowvery lowvery lowlowlowlow
Home very lowlowvery lowvery lowlowmedium
Pets mediumlowlowvery lowvery lowvery low

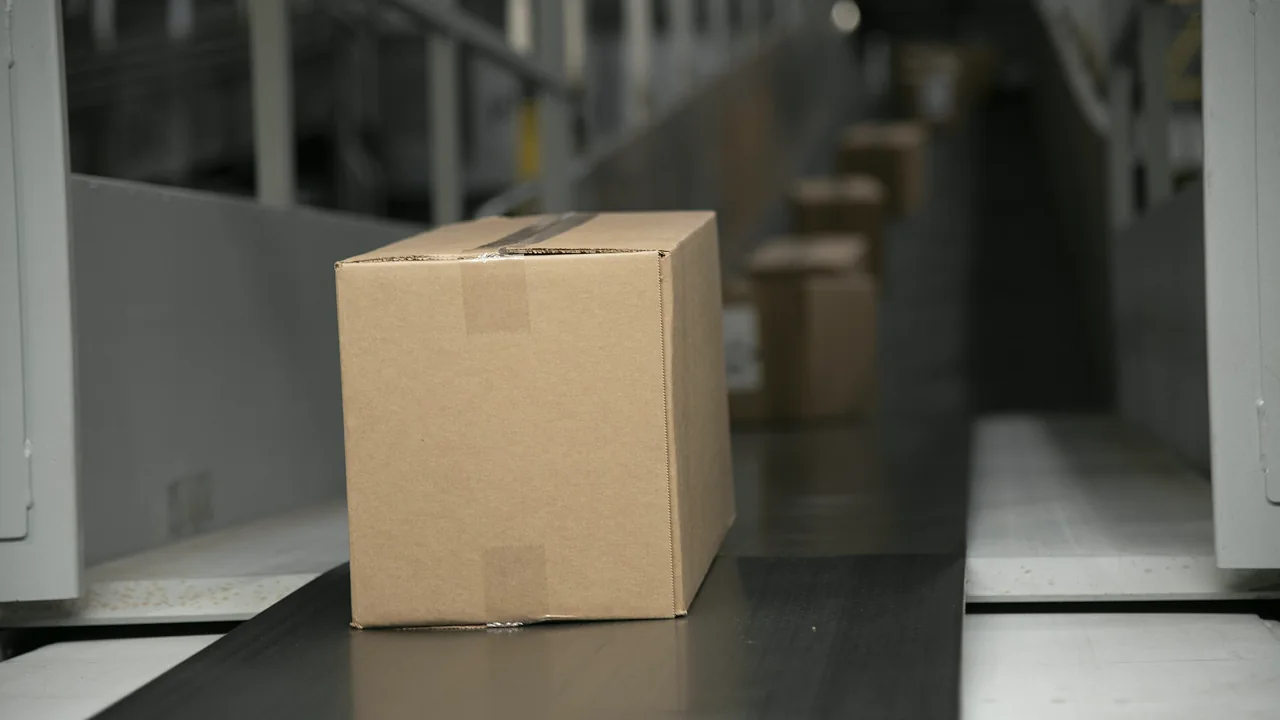
Computer vision inspection

Counting parcels on a belt and flagging the ones to check.

Synthetic data

Photo of cardboard boxes on a conveyor belt, with simulated detection boxes over each one and one flagged for review.

Real photo, public domain (U.S. Department of Agriculture). Detections simulated for this example.

Counted
128
To check
3
Precision
96.2 %
Recall
94.8 %

What the model saw and what it was

Parcels per hour

View the data as a table
What the model saw and what it was
Actual UndamagedDentedUnreadable label
Undamaged 41262
Dented 9713
Unreadable label 1238
Parcels per hour
Hour Passed To check
8:00 96 2
9:00 112 3
10:00 120 1
11:00 118 4
12:00 104 2
13:00 98 3
14:00 122 2
15:00 126 5
16:00 119 3
17:00 110 2

Does your process stall on this line?

Two lines on what runs late are enough to start.

Tell me about it